
2025 USDA Land Values Summary
The month of August often signals a season of transition and excitement—back-to-school mania, the kickoff of college football, and the return of the ever-popular pumpkin spice latte at Starbucks. In agriculture, however, August also marks the release of one of the most anticipated publications of the year: the USDA Land Values Summary.
The USDA Land Values Summary is an annual report from the National Agricultural Statistics Service (NASS) that provides average values of U.S. farmland (farm real estate, cropland, and pastureland) and the average cash rental rates for cropland and pasture. It’s important because farmland is the foundation of U.S. agriculture, and its value is a key indicator of the health of the farm economy. Rising or falling land values affect:
- Farmers and landowners – influencing borrowing power, equity, and farm profitability.
- Investors and lenders – serving as a measure of asset strength and collateral value.
- Policy and research – guiding decisions on agricultural programs, conservation, and rural development.
In short, the summary provides a national “benchmark” for assessing farmland affordability, producer balance sheets, and broader rural economic conditions. Data are collected directly from producers through nationwide surveys, with results broken down by region and state. The report first presents farm real estate values (all agricultural land and buildings), and then provides more granular analysis by cropland and pasture categories.
For Promised Land’s purposes, our focus remains on cropland values, which most directly align with our investment strategy.
Current Trends in Cropland Values
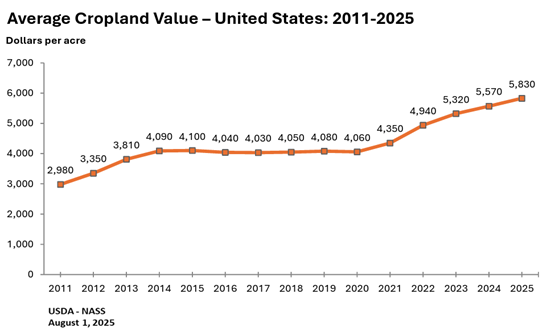
Cropland values continue to trend upward across the United States, even as commodity prices have weakened throughout much of 2024 and 2025. Historically, land values have been closely correlated with commodity prices. Many agricultural stakeholders expected land values to decline this year in response to lower commodity prices, tariff concerns, and generally declining farm income. While lower-quality land has begun to see a leveling off in values, higher-quality land and land with development potential have continued to appreciate. Note that USDA uses Average Total Cropland meaning it includes both lower quality and higher qualities farmland in the calculation. Promised Land's focus is to invest in high quality, very productive farmland meaning these averages are not reflective of the quality of Promised Land's portfolio.
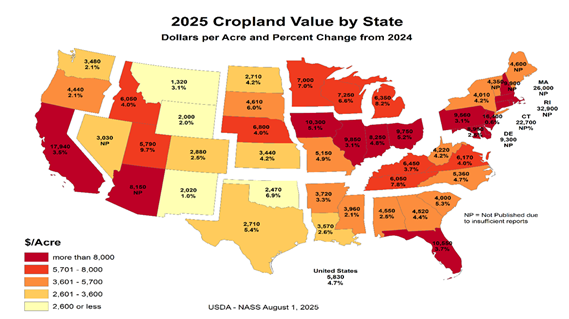
At the state level, we see the familiar pattern of strong average land values in the Corn Belt, California, and Florida—some of the most agriculturally productive regions in the country. Although these states are no longer experiencing the near double-digit growth that followed the COVID-19 pandemic, they remain resilient and continue to demonstrate strength in a challenging agricultural environment
Concerns remain, however, that these trends may not be sustainable. Tariffs continue to take effect, demand for solar and wind projects is slowing, and commodity prices lack momentum. The USDA has already revised its harvest yield expectations upward by 7.8 bushels in the August 2025 Crop Production Report compared to July’s report. Ideal growing conditions in Iowa, Nebraska, and parts of Illinois and Indiana are contributing to expectations of a large harvest, which could further depress commodity prices. As farmers move into harvest season, the global agricultural community will be monitoring these reports closely.
As Promised Land continues to develop plans for OZ 2.0, our efforts will remain concentrated in areas of the country that have demonstrated strong growth in land values and continue to show promise for future expansion.
If you enjoyed this article, check out this other article about Opportunities:
Resiliency of American Agriculture